" height="15.65460401053985px" id="E2hITFMIY" width="89px"/><path d="M 15.154 0 L 6.296 0 C 5.965 0 5.657 0.167 5.473 0.446 C 5.289 0.725 5.255 1.078 5.38 1.389 C 5.43 1.511 5.504 1.621 5.598 1.714 C 5.783 1.903 6.034 2.01 6.296 2.01 L 13.158 2.01 C 12.949 3.493 12.28 4.868 11.247 5.936 L 11.198 5.987 L 11.149 6.037 C 10.099 7.086 8.747 7.765 7.29 7.977 C 5.94 8.177 4.562 7.968 3.329 7.374 C 2.634 7.038 1.998 6.588 1.447 6.041 L 1.398 5.99 L 0 7.414 C 0.221 7.641 0.455 7.854 0.699 8.054 C 0.908 8.224 1.126 8.39 1.351 8.542 C 1.967 8.962 2.632 9.301 3.332 9.552 C 3.972 9.784 4.637 9.938 5.312 10.013 C 5.971 10.089 6.635 10.089 7.293 10.013 C 8.711 9.856 10.07 9.353 11.254 8.545 C 11.739 8.214 12.192 7.837 12.605 7.417 C 12.829 7.192 13.039 6.954 13.235 6.703 C 13.405 6.492 13.563 6.272 13.711 6.044 C 14.506 4.84 15.001 3.458 15.155 2.016 C 15.192 1.682 15.21 1.346 15.21 1.01 C 15.209 0.673 15.19 0.335 15.155 0 Z" fill="rgb(8, 46, 57)" height="10.070297475553705px" id="SUqhhb7Az" transform="translate(2.507 7.93)" width="15.210335938094289px"/></g></g></svg>)
Damage claims
Can your damage photos build the claim for you?

Yes. Software exists that automatically turns damage evidence, photos, videos, and checklist data, into structured reports and analytics, without a team member manually writing up findings after every inspection. In logistics, this shift matters a lot. Damage is discovered constantly, at receiving, during handling, before loading, and if every one of those moments requires someone to sit down and compile a report by hand, documentation either falls behind or gets skipped entirely. Automated analysis and reporting close that gap.
It is worth being precise about what "automatic" means here, because the term gets used loosely. It generally covers two things: automatically generating a structured report from field data the moment an inspection is completed, and automatically surfacing patterns and trends across many inspections, such as which routes, suppliers, or handling steps produce the most damage.
What automated damage reporting actually looks like
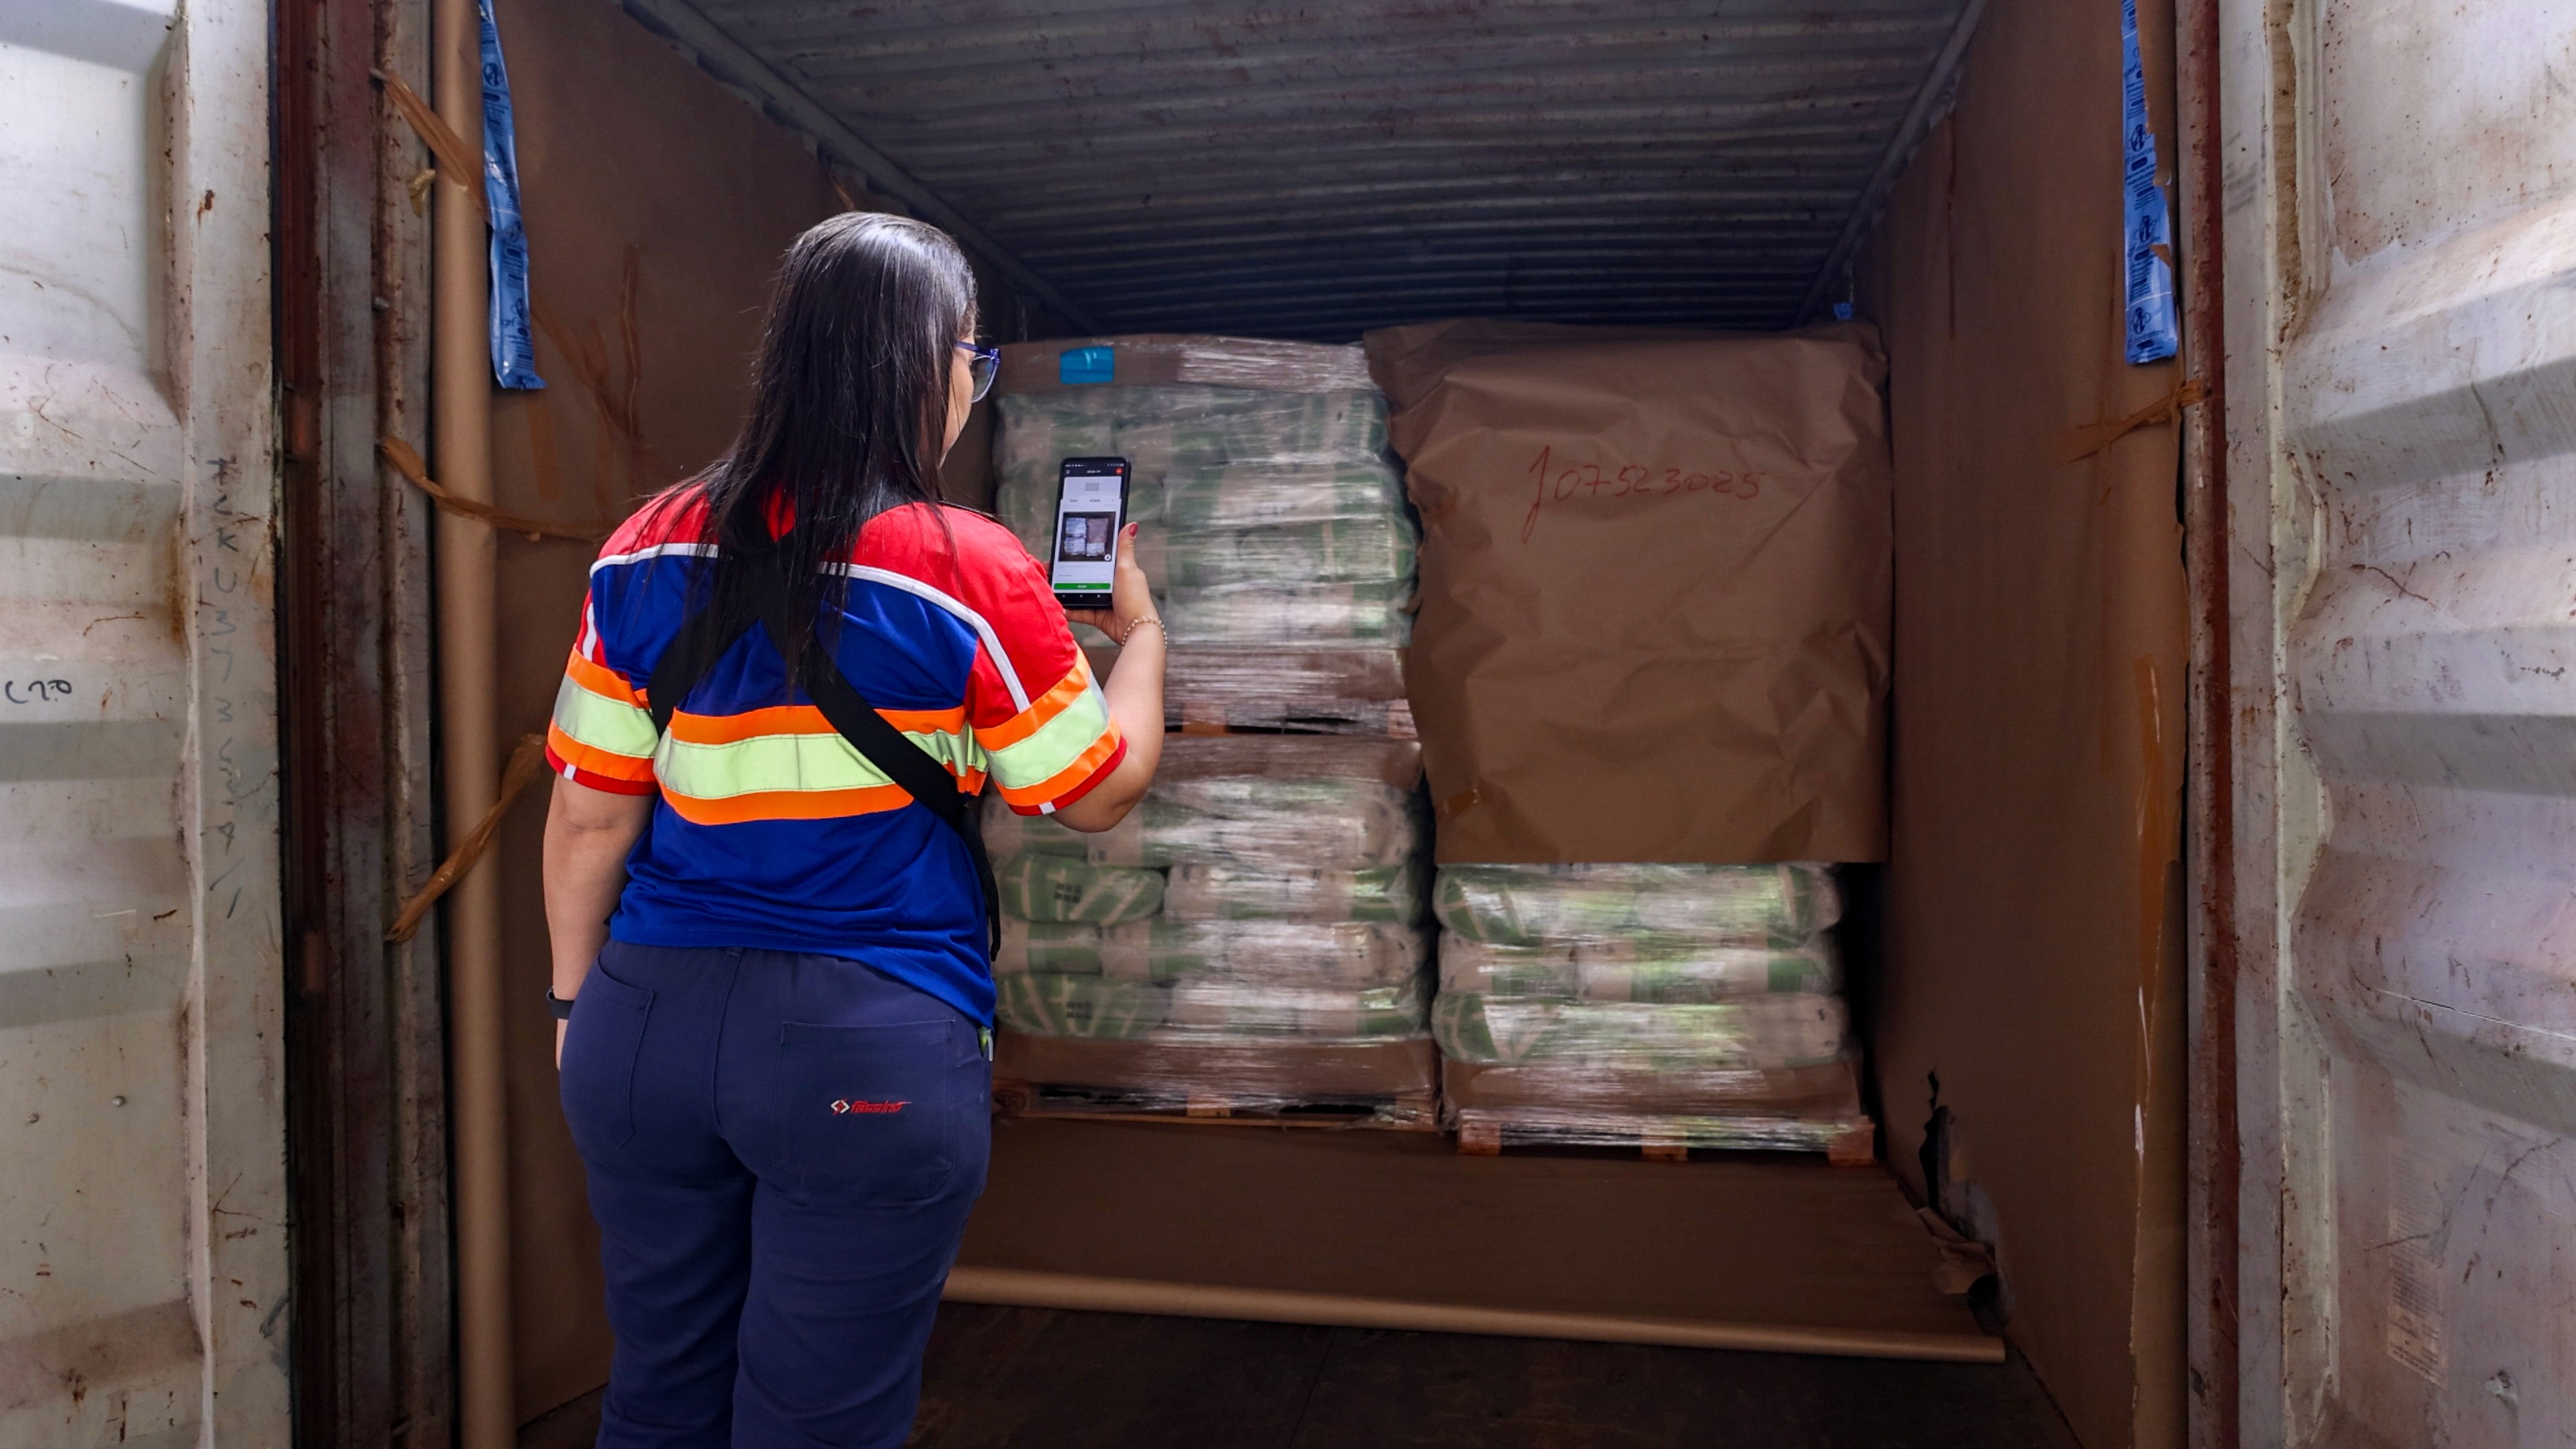
A field operator photographs the damage, notes the condition, and scans the shipment reference through a mobile app. From there, the software should:
Compile everything into a finished report immediately, with no manual formatting in Excel or Word
Tag every entry with a timestamp, location, and shipment reference, so the report is verifiable on its own
Make the report shareable in one click, so a client, carrier, or insurer can see exactly what was captured without needing their own account
Feed the underlying data into a dashboard, so damage is not just documented one file at a time but tracked as a pattern across the operation
That last point is where "analysis" comes in. A single damage report tells you what happened once. Analytics across hundreds of damage reports tell you where damage keeps happening, which is what actually helps a team fix the problem rather than just prove it after the fact.
How Cargosnap addresses this
Cargosnap is built around exactly this workflow. As field teams capture photos, condition notes, and checks through the app, Cargosnap automatically compiles that data into a structured report, with no manual copy and paste required. Reports can be shared with a single link, so customers, carriers, and partners see exactly what was captured, complete with time and location, without needing a paid Cargosnap account themselves.
On top of individual reports, Cargosnap streams field activity straight to a dashboard in real time. That means operations teams can:
Track completion rates and open issues across locations and shifts
Identify recurring damage patterns instead of treating each incident as a one off
Export the underlying data as Excel, PDF, or CSV, filtered by date, location, team, or checklist type
Connect that data to a WMS, ERP, or BI dashboard through Cargosnap's API, so damage data flows into the systems teams already use
So when a claim is opened, the report already exists. It was generated automatically at the moment the damage was found, and it is backed by data that shows whether this was a one-off incident or part of a broader pattern worth fixing.
Why this matters beyond a single claim
Manual damage reporting has two failure modes: reports that never get written because someone is busy, and reports that get written inconsistently, making it hard to compare one incident to the next. Automated reporting solves the first problem. Automated analytics solve the second, because every report is captured the same structured way, which means the data underneath it is actually comparable across shipments, teams, and time.
That combination is what turns damage documentation from a defensive, after the fact task into an operational tool. Instead of just proving a claim happened, teams can see where damage is concentrated and act before it becomes a pattern that costs money on every shipment.